OpenAI RPM, TPM, and TPD Limit Management in Production Systems
Manage four independent rate limits or watch production fail at 2am.

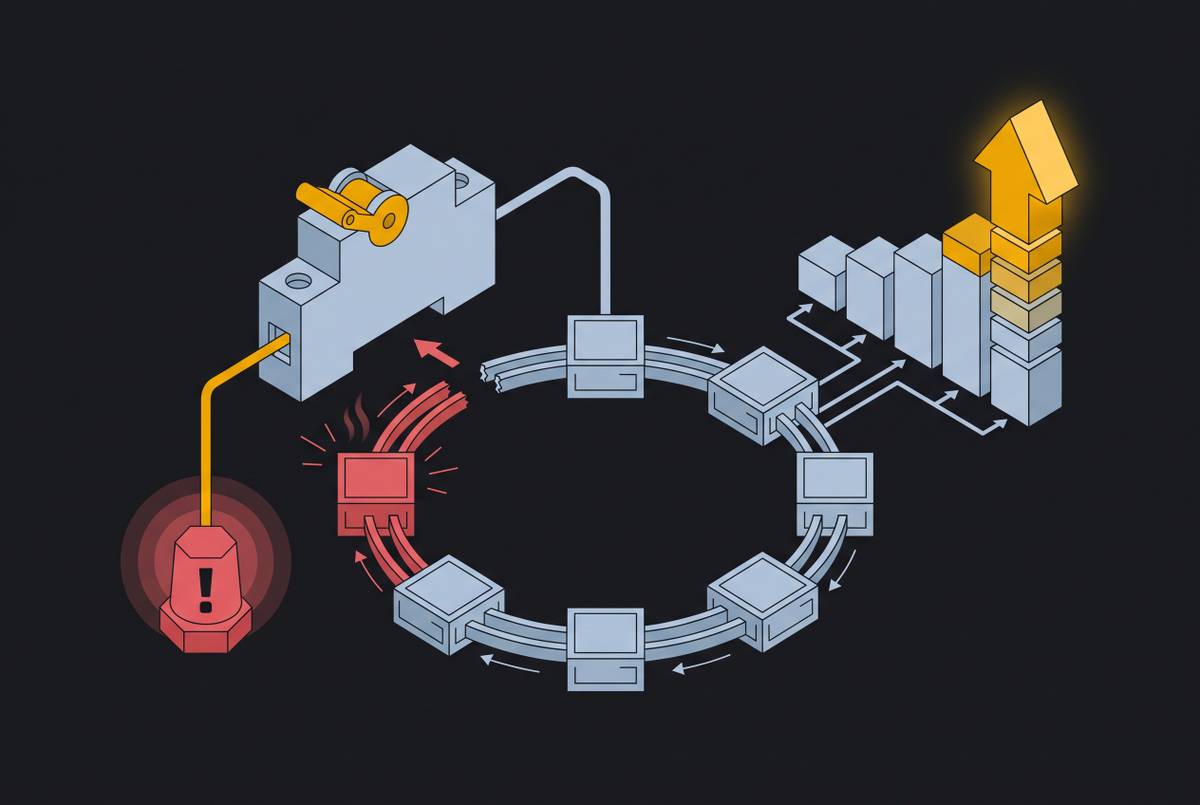
It's 2am, a batch job is running, and every request is failing with a 429, even though the dashboard shows the account barely touched its monthly spend. That contradiction is the whole problem: OpenAI doesn't enforce one rate limit, it enforces four at once, and any single one of them stops a request cold no matter how much room exists on the other three. Requests Per Minute, Tokens Per Minute, Requests Per Day, and Tokens Per Day are tracked as separate counters, and a breach on any one of them fires the error regardless of headroom elsewhere.
RPM counts raw API calls in a rolling 60-second window. It binds hardest on workloads with lots of small, fast calls, like per-user chat sessions or classification pipelines running thousands of short prompts. TPM counts combined input and output tokens, also in a rolling 60-second window, and it binds on long-prompt or long-response workloads. A single large request, a big document summarization or a long context window, can burn through most of a minute's TPM budget while RPM barely moves. RPD counts total calls over a rolling 24-hour window, and on lower account tiers it's often the first limit a production workload runs into, well before TPM or RPM become a problem. TPD counts total token throughput over that same 24-hour window, and it becomes the hard ceiling for batch-heavy pipelines moving very large volumes of text every day.
None of these windows reset at a fixed clock time. There's no midnight reset and no top-of-the-minute refresh. A burst of requests counts against the RPM window for a full 60 seconds starting from the first request in that burst, so the window is always sliding, never static.
The limits are also quantized in a way that catches teams who do the math on paper and assume they're safe. An RPM ceiling of 600 is commonly enforced in per-second slices, roughly 10 requests per second, so a burst of 20 requests in two seconds can trigger a 429 even though the full-minute average sits well under 600. And all four limits apply at the organization level, not per API key. Issuing more keys under the same organization doesn't create more quota. Every key draws from the same four shared pools.
How the six-tier system determines which limits a team faces
None of the four ceilings are fixed numbers available to everyone on day one. They scale with a tier system, and the tier a team sits in is a function of cumulative spend and, at the higher levels, account age. Tier 1 is reached after a small initial payment and grants entry-level commercial access. Tier 2 raises the bar: a moderately higher cumulative payment combined with a minimum number of days since that first payment, and both conditions have to be true at the same time, not one or the other. Tier 5 is the top of the automatic tier ladder, requiring a substantially higher cumulative spend and a longer minimum account age, with monthly usage limits rising sharply once reached.
The gap between tiers is large in practice. GPT-6 Astra and GPT-6.1 Sol run at 500 RPM and 500,000 TPM at Tier 1, climbing to 15,000 RPM and 40,000,000 TPM at Tier 5, the same pattern holds for GPT-5.6 Luna, which runs 500 RPM and 500,000 TPM at Tier 1 and 30,000 RPM and 180,000,000 TPM at Tier 5. It's a ceiling that moves by a factor of 30 or more on RPM and by a factor of 80 or more on TPM between the bottom and top of the automatic tier system.
Each model family carries its own limit profile, and those numbers don't transfer across families. A team cleared for high throughput on one model doesn't automatically get the same headroom on another. Image generation models add a fifth dimension on top of the usual four: GPT Image 2.5 enforces Images Per Minute alongside TPM, so an image-heavy workload has to budget for two ceilings simultaneously. The Batch API sits outside this entirely and keeps its own separate queue limit, denominated in queued input tokens per model, so batch work doesn't compete with an application's real-time quota at all.
Tier upgrades happen automatically once the spend and age thresholds are met. No support ticket is required until Tier 5 is reached and a team needs to go beyond even that ceiling. Below Tier 5, the system moves a team up on its own as billing history accumulates. Headroom isn't something a team can simply buy on demand mid-incident: it's earned over time through billing history, so the ceiling a team hits during a traffic spike this month was set by spending patterns from months ago.
Why teams hit limits in non-obvious ways despite apparent headroom
A 429 appears when production traffic interacts with the tier table's static ceilings in ways the tables don't capture. The published numbers describe static ceilings. Production traffic is dynamic, and the two interact in ways the tier tables don't capture. Teams that watch only one dimension, usually RPM because it's the easiest to count, miss the other three entirely.
The first failure mode is the prompt-size trap. OpenAI counts toward TPM the larger of two numbers: the estimated input tokens, or the max_tokens parameter set on the request. Azure OpenAI computes it differently, summing estimated prompt tokens and the max_tokens parameter. In both cases, setting max_tokens generously "just in case" burns TPM budget against a response that never actually gets that long. The fix is mechanical: set max_tokens as close as possible to the actual expected response length, not a padded upper bound.
The second is the quantization trap already described above. A rolling RPM ceiling enforced in per-second slices means a burst of calls in the first two seconds of a minute can fail even though the full 60-second count would have been fine. Code that batches work into fast bursts at the start of each cycle runs directly into this, even when average throughput looks comfortable on a dashboard.
The third is the shared-organization trap. If five developers work under separate API keys inside one organization, they all draw from the same four pools. A background data pipeline kicked off by one engineer can silently consume the TPM budget a customer-facing chat feature depends on, and the team running the chat feature may have no visibility into what the pipeline is doing until users start seeing errors.
The fourth is the cross-dimension trap. A workload can sit comfortably under its RPM ceiling, making far fewer calls per minute than allowed, while a single large-context request drains most of that minute's TPM budget on its own. Every request after it fails because there wasn't enough token budget left for even one more.
The fifth is the RPD trap, which shows up mostly on lower tiers. Aggressive testing earlier in the day, or a data pipeline that runs during business hours, can burn through the rolling 24-hour request budget before evening traffic even arrives. The team discovers the problem only when real users start hitting errors at the exact moment usage should be lightest.
Reading the 429 response correctly before deciding how to react
A 429 is not one error with one meaning. The response headers and body identify which of the four dimensions was actually breached, and that detail changes what the correct response looks like. Treating every 429 as a generic "wait and retry" signal wastes quota and, in some cases, makes the underlying problem worse.
The retry-after header, when present, gives the authoritative wait time before the relevant window clears. Reading that header directly reflects the actual state of the account's limit window. The error body also names the limit type that was breached: RPM, TPM, RPD, or TPD. Whether a retry in the next few seconds has any chance of succeeding, or whether the window that needs to clear is hours long, depends on that limit type. Retrying against an RPD breach on the same schedule used for an RPM breach accomplishes nothing except more failed calls.
Those failed calls carry a real cost. Unsuccessful requests still count against rate limits on both OpenAI and Azure OpenAI. A tight retry loop hammering against a TPM-exhausted window doesn't just fail repeatedly, it adds more requests on top of the already-exhausted token window, and can trigger a second limit breach layered on the first. Any retry strategy has to account for this, because a naive loop can turn one blocked dimension into two.
The better habit is a pre-flight check rather than a post-failure scramble: monitor current TPM and RPM consumption against the tier ceiling before dispatching a high-volume job, not after the first request fails. The Platform Limits dashboard shows account-specific live limits, so check it before a large batch of calls goes out; that costs far less than discovering the ceiling mid-run.
Programmatic strategies for handling rate limits gracefully in application code
Once a limit is correctly identified, application code needs two complementary behaviors: a way to recover gracefully after hitting a ceiling, and a way to avoid hitting it in the first place. Backoff handles the first. Client-side throttling handles the second. Neither replaces the other.
Exponential backoff with jitter is the standard recovery pattern. After a 429, wait a short initial period, then double the wait on each subsequent failure, up to a defined maximum. Add randomized jitter to that wait so that a fleet of clients retrying after the same failure doesn't all retry at the same instant and immediately re-trigger the same limit together. The pattern, in rough shape, looks like this: catch the 429, read the retry-after header if present and use it as the floor for the wait, otherwise compute the backoff interval, wait, retry, and cap the number of attempts so a sustained outage surfaces as a clear error. General-purpose retry libraries already implement this pattern, worth reaching for. Remember that unsuccessful retries still consume quota, so the retry count needs a hard ceiling that distinguishes a transient blip from a sustained exhaustion of the limit.
The second half of the pattern is a client-side rate limiter, sometimes called a token bucket. Application code keeps a local counter of requests and estimated tokens it has already dispatched in the current rolling window. Before sending a new request, it estimates the token cost using a tokenizer, tiktoken for OpenAI models, and checks whether that cost fits inside the remaining headroom. If it doesn't fit, the request gets queued locally. This avoids the quota cost of a failed call entirely, since the request never goes out until there's room for it.
A few prompt-level habits reduce how much of that budget gets used per request in the first place. Setting max_tokens to the actual expected response length, rather than a generous upper bound, directly reduces the TPM cost of every call, based on the counting behavior described earlier. For multi-turn applications, selective context retention, keeping only the exchanges relevant to the current task instead of the full conversation history, cuts input tokens without hurting response quality. Prompt chaining splits a complex task into shorter, sequential prompts instead of one long one; each piece of the chain consumes less TPM individually, and the chain can be paused and resumed if a limit is hit partway through. Caching eliminates duplicate calls outright: storing responses to prompts that repeat across users or sessions means an identical request gets served from cache at zero additional quota cost, which matters most for classification, moderation, or lookup tasks where the same prompt recurs constantly.
Queue-based request management for sustained high-throughput workloads
Backoff and client-side throttling work well for traffic that spikes occasionally. They start to strain once request volume is sustained near or at the tier ceiling for long stretches, because a system that's constantly retrying is a system that's constantly wasting a fraction of its own quota. At that point the right fix is architectural: a queue that shapes outbound traffic to fit the available rate-limit envelope before requests ever leave the application.
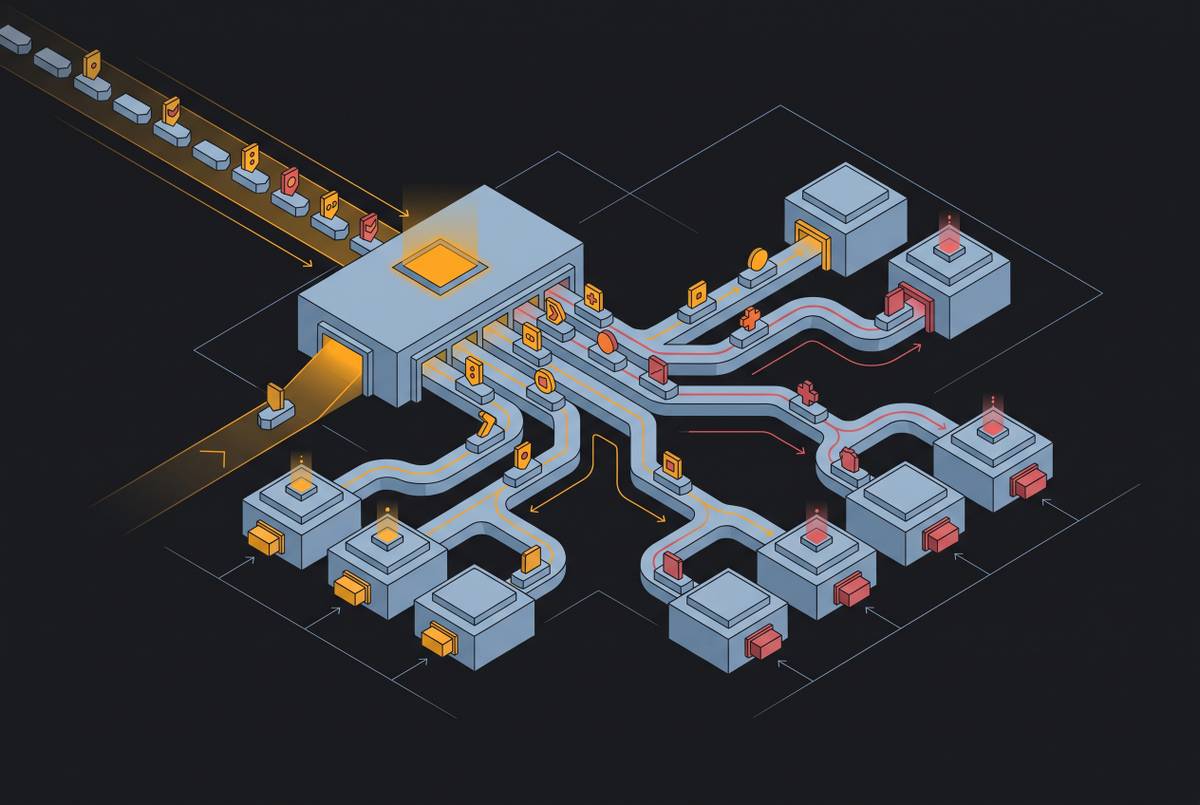
A dedicated worker process, or a pool of them, dequeues requests and enforces a dispatch rate calculated directly from the tier's RPM and TPM ceilings, rather than letting application code fire requests as fast as they're generated. That queue can support priority lanes: user-facing, latency-sensitive requests move ahead of background batch jobs, using the same queue infrastructure but different lanes within it. Backpressure matters too. When the queue grows past a depth threshold, the system should reject or defer new submissions instead of letting the queue grow without bound and hide a real capacity shortage behind a growing backlog.
The quantization trap from earlier gives this queue a specific job: spread requests evenly across the minute. Even a workload that's comfortably under its RPM ceiling on average can trip the per-second sub-limit if it releases everything in the first couple of seconds. If a dispatch worker paces requests evenly across the full 60-second window, it avoids that failure mode without needing any increase in the underlying tier.
For workloads that don't need an immediate response, the Batch API is a separate queue built for exactly this. Batch jobs draw from their own limit pool, denominated in queued input tokens per model, separate from an application's synchronous quota. At Tier 5, batch queue limits run large enough, reaching figures like 15 billion tokens for GPT-5-family models, to make the Batch API the practical choice for large-scale data processing that doesn't need results back in real time. The trade-off is timing: batch results come back asynchronously, within a deferred window. That makes it the right tool for large offline jobs, like bulk classification or dataset labeling, and the wrong one for anything a user is waiting on.
Multi-provider routing as the only path past the single-provider ceiling
Even at Tier 5, the highest automatically reachable tier, you still hit a ceiling on what one provider's rate limits will ever grant through standard channels. Manual increase requests and direct enterprise negotiation can push limits above the published Tier 5 defaults, but that process has its own timeline and isn't something an application can lean on in the middle of a traffic spike. Past a certain scale, no amount of queueing, caching, or backoff tuning inside a single provider's system closes that gap. The only way past it is aggregating capacity across more than one provider.
The case for doing so is numeric. At comparable spend levels, different providers can differ by an order of magnitude or more on RPM. Routing a given task type to whichever provider has more available headroom at that moment functions as a direct multiplier on total throughput, not just a hedge against one provider's outage.
Building that kind of routing requires two things in place. First, you need a unified API layer, so application code issues one consistent call pattern instead of writing separate provider-specific logic for every endpoint it might route to. Second, real-time visibility into remaining quota across every active provider in the mix, not just the dashboard for one of them. Without that visibility, a routing layer is just guessing which provider has room, and guessing defeats the entire purpose of routing around a limit in the first place.